It seems every 5 years, the leadership of our country swings in the opposite direction like a pendulum. The last two elections saw the FNM oust the PLP in 2017 in the biggest electoral defeat in our country’s history. In 2021, they felt the same stick they beat the PLP with.
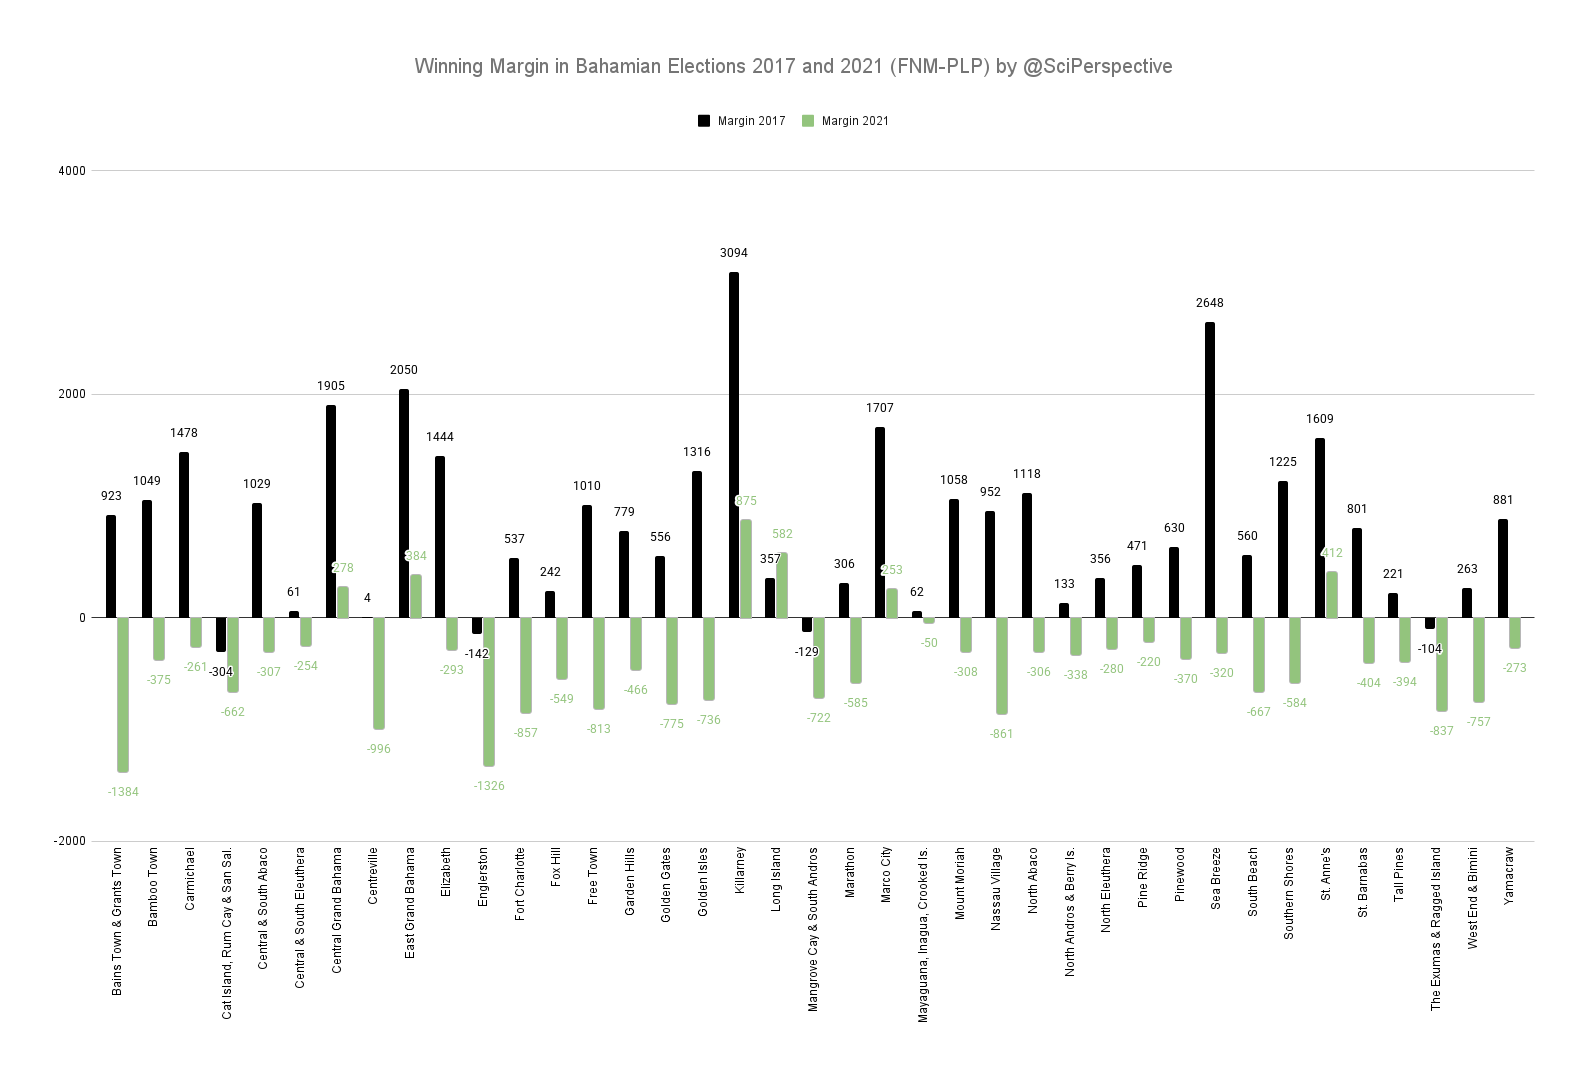
The chart below is created using the official election results for 2017 and 2021. Constituencies are organized in alphabetical order from left to right. For each year, the difference between the number of votes for FNM and PLP are calculated by subtracting the PLP total votes from the FNM total votes in that constituency.
The result shows PLP victories below the line and FNM victories above zero. The 2017 data is represented in Black, while the 2021 data is represented in green.
This means that where the two colored bars show up on the same side of the graph, the incumbent retained their seat.
2021 was a weird time. Still reeling from the impacts of Hurricane Dorian and COVID 19, many of the elderly, the affluent and the educated who believed in the threat that COVID 19 posed did not come out to the polls. Indeed although the registered voters increased by almost 13,000, the number who came out to vote decreased by nearly 34,000.
This year, I expect the vote to be stronger. More people will come out to vote again, but I doubt any margin of victory will be higher than these past two elections.
If you enjoy this type of data and analysis, like, follow and share. you can also follow me on Facebook, Instagram, YouTube, TikTok and X.
Register to vote if you can and make an educated choice for the best candidate for you and your community.
Until then, go forth and be sustainable.

Leave a comment