These are some of my scientific work or works related to teaching and learning science.
eBird Data
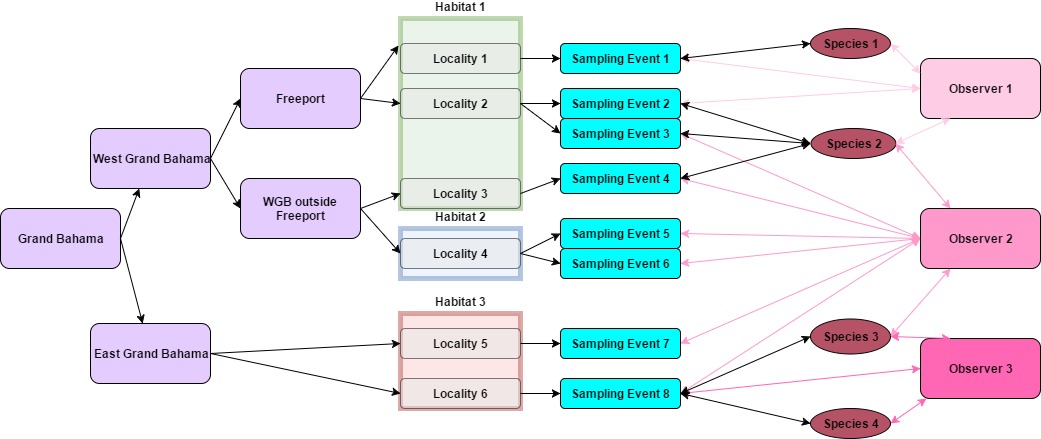
I often work with eBird data so it is important to understand what eBird data is. The diagram below illustrates the relationships between different elements of ebird data on the Island of Grand Bahama. Within the island, the data is split into two broader regions West and East Grand Bahama (analogous to counties within a state in the USA). Freeport is a city within West Grand Bahama. Within a region, county or city there may be multiple habitat types. Within the islands, regions, cities and habitats, people can visit multiple Localities designated by specific geographic coordinates and a unique locality identifier assigned by ebird. Whenever a person or group conducts a survey, that survey has to take place at a specific time and at a location, even if that location is vague like “Grand Bahama Island”. People can return to the same locality to conduct another survey later, but you cannot be at two different places conducting surveys at the same time. These surveys are called sampling events. You can have multiple observers take part in the same sampling event (event 8). You can have two people visit the same site but conduct surveys separately (events 2 &3). Some localities have been repeatedly surveyed by one person (Locality 4), or different people (Locality 2). Similarly, some species may be recorded by only one person at one site (species 1), at different sites by different people, or multiple people at the same site (species 3). SOme people may record only one species at a location while others may see many even while birding together at the same locality during the same event (Observers 2 &3; sampling event 8).
Bahamian Environmental Regulations
Are you interested in learning more about the regulations on Bahamian natural resources? Check out these links.
Maps
I believe to truly understand manage or conserve native biodiversity, we have to associate our records with location information. Here are a few maps and mapping tools I have created or utilized to support this of work. I focus on open source and open access tools so that Caribbean agents and agencies can recreate the work without relying on expensive software.
Classified Habitat Maps
Using the Google Earth engine API, I classified the habitat on grand Bahama Island into 7 categories (Water, Pine, Wetland, Sand, Urban, Grass and High Water Table Communities). I visually identified areas that fit into those categories and marked them with the geometry creator at least 100 per category, though I kind of got carried away with some. I imported freely available Landsat 8 OLI imagery in bands 2-7 ( Here is why I chose those bands ). I used the Random Forest classification and ran a confusion matrix to see how well the classification fit the data. When I used the seven classes, the confusion matrix said my accuracy was about 50% Kappa was a little less than 0.5 That means it was better than random, but also not spectacular.
I then reduced the number of categories. I combined the Wetland and High Water Table Communities because they were regularly confused and intermingled across the landscape. I also combined Urban (built environments) with grass (athletic fields, golf courses) as these generally represented human altered landscapes.
Bird Species Heat Maps
Here is a heat map of Common Ground Dove Observations exported from a Google Fusion Table. Keep in mind, this shows where they were seen before May 2016, not necessarily where it can be seen. You should be able to toggle street map and satellite image and scroll around the island or zoom in and out. This data is based on eBird Data which is freely available online and you can see the eBird heat map at COGD on eBird.
So, if the data and maps are freely available online, why make a map of my own? Mostly to see if and how it could be done and how much it would cost. Time, money, knowledge. The knowledge to create the map was also freely available online, but I had not been introduced to google fusion tables until about a year ago (2015). The process costs nothing! No website hosting, just a google email account and no special subscription. Also, the map loads fast and it is one click shareable. You ask me for locations with Ground Doves and I say ok. Boop beep boop, here you go to the link and that is all you have. No distractions. The web map I created was also immediately available to colleagues in several countries and most importantly, remote Bahamian islands with cellular data access on their phones shared via social media and email. Colleagues that were not near a computer. These are some of the real world challenges we see with accessing data about our country and natural resources online in the Bahamas, Caribbean and Developing world. Freely avalable does not necessarily mean accessible because of other issues like internet or computer access.
There are however several downsides to this avenue.
Fast means less content. No map labels, citations etc. and a visitor cannot further explore the data. Scientists really want this when they are sitting at a desk. There is a more robust map creator through the Google Earth Engine API, but you have to learn to write code.
In the end, anyone can bust out a map like this in about 10-15 minutes if they have their data ready. Think about a map with incidences of invasive species (MTIASIC crew), Bahamian snake sightings (Looking at you Scott Johnson) or Bahama Parrots of Nassau (Lynn, Shelley). The beauty of this is ownership. We can start telling our own stories quickly, with data. And if someone wants to see the data, we can share that too.
I hope you enjoyed this map. Contact me for details on the process by commenting on my blog or the social media account you saw this on.
I created this interactive map regarding the roles mentioned in forestry management legislation.
follow me on Ancilleno Orlando Davis on ResearchGate
